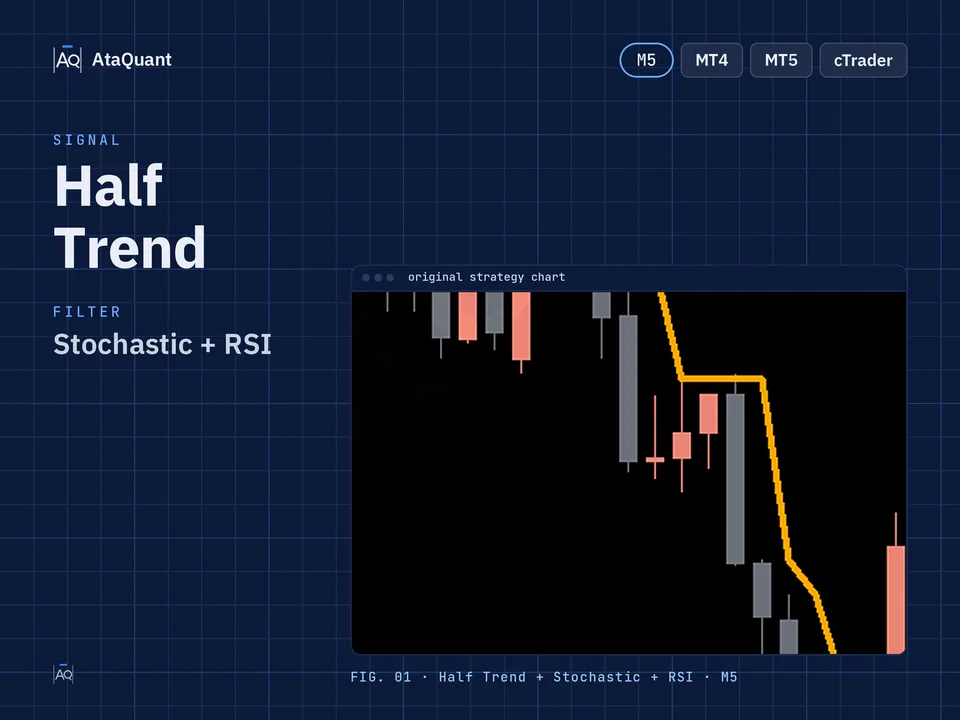
A Powerful Trading Strategy Utilizing the Half Trend, Stochastic, and RSI Indicators
Boost your trading results with the Half Trend, Stochastic & RSI Strategy — a powerful setup combining Half Trend, Stochastic, and RSI. Optimized for 5, 15, and 30-minute trading, it enhances precise entries and short-term profits.

Ready-made EA for this strategy is provided below — scroll to purchase
◊ Introduction to the Hulf Trend Scalping Strategy
Scalping strategies require precise tools to identify optimal entry and exit points. In this article, we present a powerful trading strategy that combines three popular indicators: Half Trend, Stochastic, and RSI. By integrating these indicators, traders can better identify market trends and execute buy and sell positions with controlled risk. This strategy is recommended for 5, 15, and 30-minute timeframes and is ideal for those seeking fast and accurate short-term trading methods.
◊ What is the Half Trend indicator?
The Half Trend indicator, similar to the Super Trend indicator, displays the trend through three lines.
Central Line: This represents the actual trend, with the blue line indicating bullish market sentiment and the red line reflecting bearish market sentiment.
Upper and Lower Lines: These lines represent the Average True Range (ATR), which can be used to determine the stop loss limit.

◊ Indicators Used
1- HalfTrend Indicator
2- Stochastic Indicator
3- RSI Indicator
◊ The trading time frame of this strategy
This strategy is recommended for 5, 15, and 30-minute timeframes and is ideal for those seeking fast and accurate short-term trading methods.
◊ Inserting indicators in TradingView
Inserting the Hulf Trend indicator in TradingView
This indicator can be used in the TradingView environment. To insert it on the chart, from the trading view indicators section, search for the name half trend as shown below, and activate it. Make sure that the author of this indicator is as shown below.

◊ Settings of indicators
In this strategy, three indicators, Half Trend, Stochastic, and RSI, are used, and the settings of each will be explained separately.
Half Trend Indicator settings
Apply the changes in the Style section, as shown in the image below.

In the Inputs section, change the Amplitude option to 4 and check the Show Arrows tick.

RSI Indicator settings
In the Style section, we change the upper band of RSI to 90 and the lower band to 10. As in the picture below

In the Inputs section, we put the value Length = 2.

Stochastic Indicator settings
In the Inputs section, we make the following changes:
%K Length = 9
%K Smoothing = 4
%D Smoothing =3

◊ Prerequisite for using the half Trend strategy
The Long Positions: Focus on areas where the central line of the Half Trend indicator turns blue, indicating a bullish trend.
The Sell Positions: Pay attention to areas where the central line of the Half Trend indicator turns red, indicating a bearish trend.
Want to Automate this Strategy? Check out Ready-Made Expert Advisor here
◊ How to open a long position with the Hulf Trend Strategy
● Entry Rules
To open the long position with this strategy, the prerequisite must be met first, and then we check the following two conditions.
First Condition: When the RSI (Relative Strength Index) is below 10, it suggests that the asset is in the oversold range.
The second condition is that the stochastic cross has occurred.
A buy signal is issued when the above two conditions are met along with their prerequisites.
●Exit Rules
Stop Loss: We consider the bottom line of Half Trend as the stop loss when entering the trade.
Target or Profit: We will exit the trade when the Stochastic indicator exhibits a Downward cross, or the Half Trend central line turns red. Whichever condition occurs first will serve as the basis for exiting the position.

◊ How to open a short position with the Hulf Trend Strategy
● Entry Rules
Its conditions are the opposite of the long position.
To open the short position with this strategy, the prerequisite must be met first, and then we check the following two conditions.
First Condition: When the RSI (Relative Strength Index) is above 90, the asset is in the overbought range.
The second condition – A Stochastic downward cross has happened.
A Sell signal is issued when the above two conditions are met along with their prerequisites.
●Exit Rules
Stop Loss: We consider the upper line of Half Trend as the limit of a stop loss when entering the trade.
Trade Target or Profit: We will exit the trade when the Stochastic indicator exhibits an upward cross, or the Half Trend central line turns blue. Whichever condition occurs first will serve as the basis for exiting the position.

Note: Typically, the second condition (one or more candles) happens after the first condition. On the other hand, the distance between these two conditions must be reasonable. (Two to three candles can be sensible)
Conclusion
The Half Trend, Stochastic, and RSI combination strategy offers a practical and reliable approach for short-term scalping trades. By carefully following the entry and exit conditions and using the Half Trend lines as stop-loss levels, traders can reduce risk and increase the probability of successful trades. Implementing this strategy alongside proper money management provides an excellent opportunity to improve trading performance and make more informed decisions in the financial markets.
Looking for more? Discover our other forex trading strategies and see how they can fit your trading style.
Save time – automate your trades.
Why stick to manual trading when you can let automation work for you? We transform any strategy into a fully functional Expert Advisor. Or choose from our collection of ready-to-use EAs in the shop.
Visit our Expert Advisor Shop
Check out our Free Indicators here
The EA for this strategy
The rules above, coded as a ready-made Expert Advisor. See its inputs and platforms, or ask for a modification.