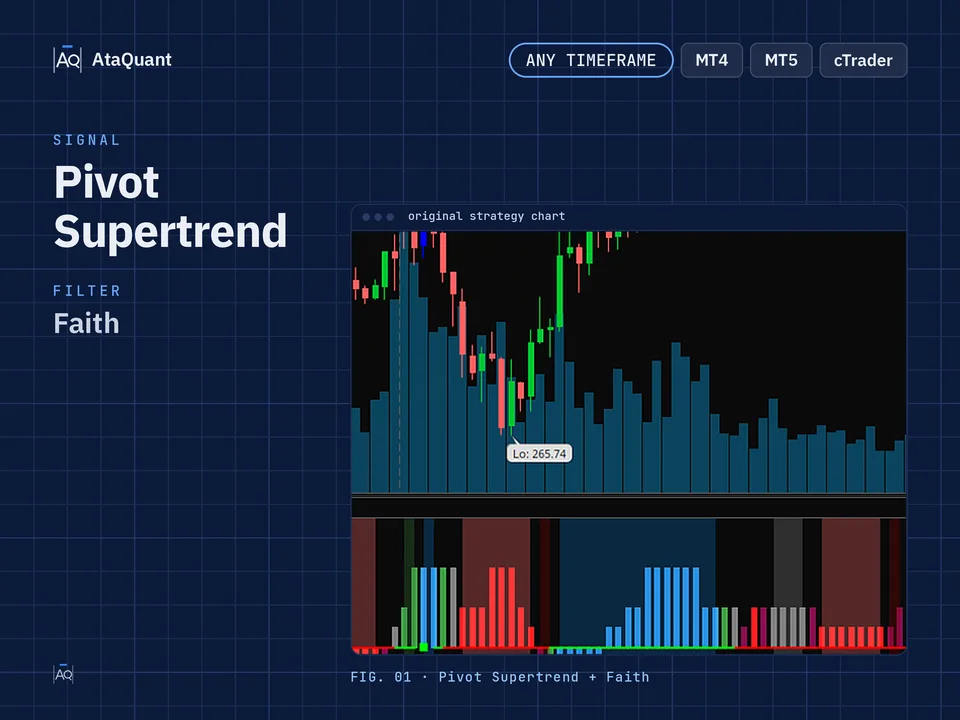
Trading strategy with Faith indicator
Boost your trading results with the Faith Indicator Strategy — a powerful setup combining Faith, Pivot Point Supertrend, and ADX/DI. Optimized for 3-minute and higher trading, it ensures accurate entries and consistent profits.

Ready-made EA for this strategy is provided below — scroll to purchase
◊ Introduction to the Faith Trading Strategy
In financial markets, accurately measuring the strength of buyers and sellers is one of the most essential elements for achieving successful trade entries. The trading strategy based on the Faith Indicator combines three powerful analytical tools—Faith, Pivot Point Supertrend, and the ADX/DI system—to create a structured and reliable framework for identifying high-probability entry points.
In this approach, the Faith Indicator evaluates supply and demand and highlights shifts in market strength, providing the initial signal for potential entries. The Pivot Point Supertrend indicator then identifies the overall trend and potential reversal zones. Finally, the ADX and DI indicators confirm whether the market has enough momentum to justify entering a trade.
The synergy between these three components ensures that traders only enter positions when the trend direction, market strength, and buyer-seller dynamics are all aligned.
◊ Indicators Used
Apply the Faith Indicator
The Faith indicator compares buyers' demand with sellers' supply volume and is used as an analytical tool in financial markets. This indicator detects and predicts price changes in markets. Faith acts as a measure of market performance and indicates the strength and weakness of the market based on trading volume and the ratio of buy and sell contracts in the market. Faith also acts as a gauge for changes in the strength of buyers and sellers in the market.
This indicator issues trading signals to traders to enter the market by displaying colored backgrounds and red and blue bars. Whenever the background is blue, and a blue bar appears, it is a buy signal, and whenever the background is red, and a red bar is displayed, it is a sell signal. In this strategy, the Faith indicator is used to confirm entry into a trade.

Use the Pivot Point SuperTrend Indicator
Whereas the primary condition for market entry is the buy and sell signals generated by the Pivot Point Supertrend indicator. By combining the levels of pivot points and the super trend, in addition to showing the current market trend, this indicator also issues a buy or sell signal.
Use the ADX and DI Indicator
In this trading setup, the final confirmation for market entry comes from the ADX and DI indicators. When the ADX curve is above the horizontal line 20, and the green +DI line is above the red -DI line, we only take buy positions. Conversely, when the ADX curve is above the line 20, and the green +DI line is below the red -DI line, we open sell positions.

◊ The trading time frame of this strategy
This strategy can be used on a 3-minute timeframe or higher.
◊ Inserting indicators in TradingView
Inserting the Pivot Point SuperTrend Indicator in TradingView
To add the Pivot Point Supertrend indicator in TradingView, go to the indicators section and search for 'Pivot Point Supertrend'. As shown in the image below, activate it on your chart. Make sure the author is 'Lonesome TheBlue'.

Inserting the Faith Indicator in TradingView
Search for 'Faith Indicator' and activate it on your chart as shown in the figure. The author of this indicator is 'eykpunter'.

Inserting the ADX and DI Indicator in TradingView
Search for 'ADX and DI' and activate it on your chart as shown in the figure. The author of this indicator is 'BeikabuOyaji'.

Learn more:
Trading strategy with ADX and DI indicator
◊ Settings of indicators
Faith Indicator settings
Set the 'periods for averaging' option in the INPUTS section to 15.

Pivot Point SuperTrend Indicator settings
Use the default settings.
ADX and DI Indicator settings
Use the default settings.
Want to Automate this Strategy? Check out Ready-Made Expert Advisorhere
◊ How to open a long position for using the Faith Setup
● Entry Rules
To execute a long trade, the following conditions must be met in order:
Condition 1 – The Pivot Point Supertrend indicator must issue a buy signal.
Condition 2 – In the Faith Indicator, while the background is blue, a blue bar must appear.
Condition 3 – In the ADX and DI indicator, the green line must be above the red line.
Condition 4 – The ADX line in the ADX and DI indicator must be above the horizontal line 20 and trending upwards.
Once all the above conditions are met, we will open a long position.
Note: The order of meeting Conditions 3 and 4 is not important. In some cases, Condition 4 may occur first, followed by Condition 3.
●Exit Rules
Stop Loss: We consider the nearest support level as the stop loss.
Target or Profit: The profit from this trade is based on the risk-to-reward ratio, which can include one of the following options depending on the trader's risk tolerance:
1- Risk-to-reward of 1:1 (low-risk)
2- Risk-to-reward of 1:1.5 (moderate risk)
3- Risk-to-reward of 1:2 (high-risk)

◊ How to open a short position using the Faith Setup
● Entry Rules
To execute a short trade, the following conditions must be met in order:
Condition 1 – The Pivot Point Supertrend indicator must issue a sell signal.
Condition 2 – In the Faith Indicator, while the background is red, a red bar must appear.
Condition 3 – In the ADX and DI indicator, the red line must be above the green line.
Condition 4 – The ADX line in the ADX and DI indicator must be above the horizontal line 20 and trending upwards.
Once all the above conditions are met, we will open a short position.
Note: The order of meeting Conditions 3 and 4 is not important. In some cases, Condition 4 may occur first, followed by Condition 3.
●Exit Rules
Stop Loss: We consider the nearest resistance level as the stop loss.
Target or Profit: The profit from this trade is based on the risk-to-reward ratio, which can include one of the following options depending on the trader's risk tolerance:
1- Risk-to-reward of 1:1 (low-risk)
2- Risk-to-reward of 1:1.5 (moderate risk)
3- Risk-to-reward of 1:2 (high-risk)

◊ Tips and summary
1- Under no circumstances should you open real trades before practicing and repeating this strategy on a demo account or with historical charts.
2- Adhere to all the stated rules and regulations, and only open a trade if all conditions are met.
3- The timeframe for using this strategy is 3 minutes or higher.
Conclusion
The trading strategy built around the Faith Indicator offers a systematic and dependable method for trading trending markets. By requiring three layers of confirmation—trend signals from Pivot Point Supertrend, strength analysis from the Faith Indicator, and momentum verification from ADX and DI—the strategy significantly reduces the risk of false entries.
However, like any professional trading method, mastering this strategy requires practice on historical charts and demo accounts. Strictly following the entry rules, setting logical stop-loss levels, and adhering to clear risk-to-reward ratios are essential for long-term success.
Ultimately, this strategy can become a powerful tool for traders seeking precise, filter-based entries backed by strong market structure and momentum confirmation.
Looking for more? Discover our other forex trading strategies and see how they can fit your trading style.
Your strategy, your Expert Advisor
We can turn any trading strategy into a custom EA designed for your needs. Looking for tools to analyze the market first? Don’t miss our collection of free trading indicators – and when you’re ready, explore our EA Shop for ready-made solutions.
Visit our Expert Advisor Shop
Check out our Free Indicators here
The EA for this strategy
The rules above, coded as a ready-made Expert Advisor. See its inputs and platforms, or ask for a modification.