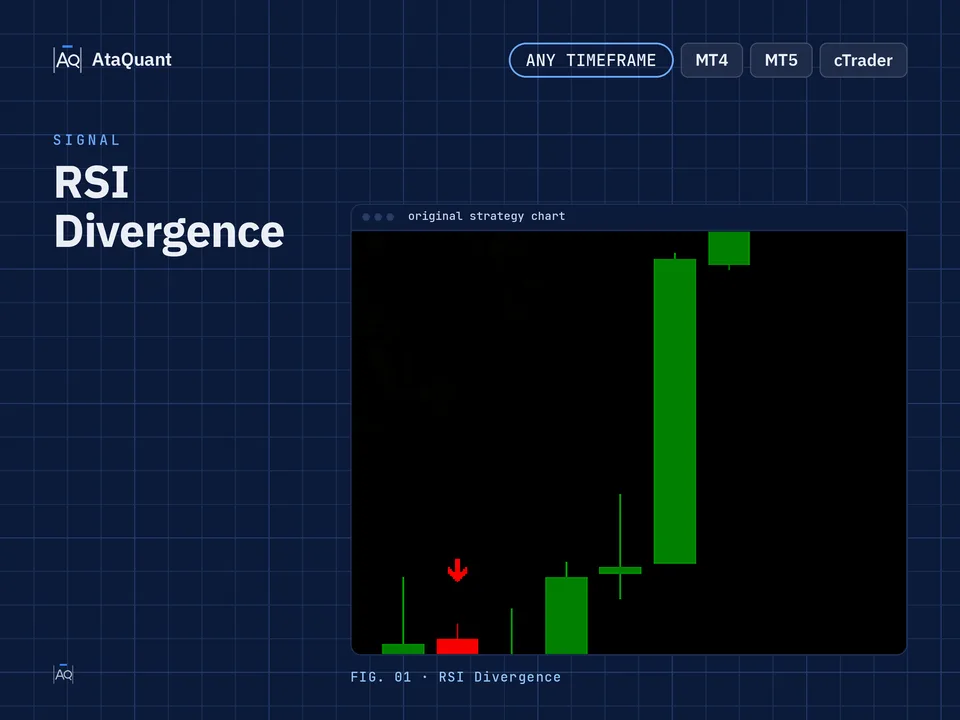
Types of divergence trading strategies: A Comprehensive Overview
Boost your trading performance with the Divergence Trading Strategy — a powerful setup combining RSI, MACD, and dynamic support and resistance. Optimized for trend and swing trading, it enhances accurate entries and consistent profits.

Types of Divergence Trading Strategies: A Comprehensive Overview
Ready-made EA for this strategy is provided below — scroll to purchase
◊ Introduction to the QQE MOD & Range Filter Trading Strategy
Divergence is an essential concept in technical analysis. Many analysts use it to decide when to buy or sell stock.
In this article, we will explore various divergence-based trading setups and provide valuable insights to help you achieve your desired trading results.
Two Minutes with Divergence Trading Strategies
This episode of Strategy Bites focuses on Divergence Trading. We cover regular and hidden divergences and show how they work with setups like dynamic support & resistance and price channels. A clear and concise audio guide to trading with divergence.
◊ Definition of divergence and its application
Divergence, a fundamental concept in technical analysis, refers to a scenario where the price of an asset exhibits a contrary movement to other data, often represented by a technical indicator.
For example, when an indicator such as the RSI moves against the price chart, it can be said that a divergence has occurred.

We use different indicators to detect divergence, such as MACD, RSI indicator, CCI indicator, etc. But the simplest and most practical of them is RSI divergence.
◊ Detection of divergences
1- First, we find two peaks or two valleys formed back-to-back in the price chart and draw the trend line of these two.
2- We also find their corresponding points in the indicator and draw a trend line for them.
3- We check whether the slope of these two trend lines in the price chart and the indicator are in the same direction.
If it is in the same direction, we do not have any divergence, but if these slopes are not on the same path, there is a possibility of divergence. Check the following figure carefully for a better understanding:

◊ Types of divergences
There are different types of divergences that you can recognize in the future of the market by recognizing each one to trade in the direction of the trend.

1- Regular divergence(RD)
This type of divergence occurs when the indicator and the price chart behave oppositely. When a regular divergence occurs, the price trend weakens and tends to reverse.
This type of divergence is divided into two categories: positive regular divergence and negative regular divergence.
Positive regular divergence(RD+)
This type of divergence occurs at the end of a downward trend and in lows, so the price creates a lower low than the previous low, but the indicator does the opposite and registers a higher low than its previous low. In this case, the price tends to grow and is a buy signal. For a better understanding, look at the image below:

Negative regular divergence(RD-)
Negative regular divergence occurs at the end of an upward trend, in such a way that the price creates a new higher high than the previous high, but the indicator cannot create a higher high than its previous high. Negative regular divergence indicates weakness in buyers, and the strength of sellers will be greater than that of buyers. And it is a sell signal. For a better understanding, pay attention to the following image:

2- Hidden divergence (HD)
Hidden divergence occurs when the price is corrected and indicates the continuation of the trend. This type of divergence is divided into two categories: positive hidden divergence and negative hidden divergence.
Positive hidden divergence (HD+)
This divergence occurs when the price forms a higher low than its previous low, but the indicator creates a lower low than the previous low. You can buy the stocks by observing and identifying this type of divergence. For a better understanding, you can see the contrast between the price and the indicator in the figure below:

Negative hidden divergence (HD-)
This divergence is precisely the opposite of bullish hidden divergence. It occurs in a downtrend, where the price chart forms a new lower high compared to the previous high, while simultaneously, the indicator forms a higher high than its previous high.
Observing this type of divergence can be a warning about the share falling. To better understand the hidden negative divergence, carefully examine the figure below.

Want to Automate this Strategy? Check out Ready-Made Expert Advisor here
◊ Divergence Trading Strategies
Now that we've learned the different types of divergences, let's explore some divergence trade strategies.
A- Dynamic Support and Resistance Levels Strategy with Divergence.
Dynamic support and resistance levels, ascending or descending trend lines, are entirely susceptible to divergence. By forming a divergence at these levels, you can trust the desired level and decide to enter or exit the trade. To implement this strategy, we go through the following steps.
1- First, we draw a trend line from the past and extend it to the future.
2- We wait until the price hunts the drawn trend line.
3- We check the indicator and the price chart. If there is a divergence, we enter the trade.
4- Place the stop loss below the previous valley in an uptrend (and in a downtrend above the previous peak).
5- TP (the profit) of the trade is one to two.
(Twice the distance between the damage limit and the entry point is the amount of TP) [1:2]

As you can see in the image above, the price creates a divergence when approaching the dynamic resistance line, and this confirmation increases our confidence in this level.
B- Channel Divergence Strategy
Whenever you can draw a channel for the price, you can usually expect a divergence at the top and bottom of the channel. So, the steps of this strategy are similar to the previous one. We draw a channel for the price chart and wait until the price reaches the top or bottom of the channel.
For example, when we hunt the bottom of the channel, we do not buy, but we check if there is a possibility of divergence at this point or not. If confirmed, we will open a long position.
We set the upper or lower stop loss and its target on the other side of the channel. Of course, for capital management, it is better to reduce half of the trade volume when it hits the middle line of the channel and change the remaining stop loss to the entry point so that we do not suffer if it returns to the initial point.

◊ Important Points of Divergence
1- Divergence is not the cause of change or continuation of the trend, but a tool to identify them. So seeing the divergence with other trading tools increases your confidence in the trade.
2- There is not necessarily a divergence whenever the trend changes. The presence of divergence is a sign to predict a trend change, not a seal of approval.
3- One of the most common mistakes in identifying divergences is not correctly identifying the trend line (upward or downward). Pay close attention to the highs and lows, also the ascending or descending nature of the trend line, as failure to do so can lead to erroneous decisions and financial losses.
4- Divergence can also be used in other technical patterns. Elliott waves, harmonic patterns, and reverse patterns can be mentioned among these patterns. Creating divergence in each increases their credibility, and you can look for trading opportunities for buying and selling using technical tools.
Conclusion
Divergence is one of the most powerful and insightful tools in technical analysis, helping traders anticipate potential trend reversals or confirm trend continuation with greater confidence. By understanding the difference between regular divergence (trend reversal signals) and hidden divergence (trend continuation signals), traders can significantly improve the timing and accuracy of their entries and exits.
However, divergence should never be used in isolation. Its true strength emerges when combined with other technical tools such as dynamic support and resistance levels, channels, trend lines, and structured risk management. As discussed, applying proper stop-loss placement and maintaining a favorable risk-to-reward ratio (such as 1:2) are essential components of a disciplined divergence trading approach.
Like any trading method, mastering divergence requires practice, precision in identifying highs and lows, and disciplined capital management. When applied correctly and strategically, divergence setups can become a consistent and reliable part of your trading system.
If you want to automate divergence-based strategies or transform your trading logic into a professional Expert Advisor (EA), our team at AtaQuant is ready to help you turn your strategy into a fully operational trading system.
Looking for more? Discover our other forex trading strategies and see how they can fit your trading style.
All-in-one trading resources.
From free custom indicators to ready-to-use Expert Advisors, we provide everything you need to trade smarter. Got your own idea? Let us build a tailored EA that follows the rules of your strategy.
Visit our Expert Advisor Shop
Check out our Free Indicators here
The EA for this strategy
The rules above, coded as a ready-made Expert Advisor. See its inputs and platforms, or ask for a modification.