A Streamlined Trading Approach: Integrating Stochastic RSI and Awesome Indicators
The stochastic RSI indicator is made from two famous indicators, RSI and Stochastic. This indicator is displayed graphically and used to analyze market behavior and find suitable entry and exit points. In this strategy, the basis for entering the trade is the signal of the Stochastic RSI indicator, and we also use other two indicators to eliminate false signals. If confirmed by these two indicators, we enter the transaction.

The main signal this indicator provides is the trading signal in oversold and overbought areas. Thus, when the stochastic indicator reaches a bottom in the oversold region (below 20) and trends upward by crossing the horizontal line at 20, it generates a buy signal. Conversely, when it surpasses 80 in the overbought area, creating a ceiling, and subsequently crosses the horizontal line at 80 in a downward direction, it triggers a sell signal.

In this strategy, the basis for entering the trade is the signal of the Stochastic RSI indicator, and we also use the following two indicators to eliminate false signals. If confirmed by these two indicators, we enter the transaction. These indicators are:
1. Awesome Oscillator: We have used Awesome to confirm entering the trade.
2. CMF Indicator: The second confirmation for entering the trade involves utilizing this oscillator.

The trading time frame of this strategy
The recommended time frame to use this strategy is 15 minutes.
Settings of indicators
The settings of all indicators are the same as the default settings.
How to open a long position using this strategy
To make a long trade, the following conditions must be met:
The first condition –In the Stochastic RSI indicator, the blue line crosses the horizontal line at 20 upwards.
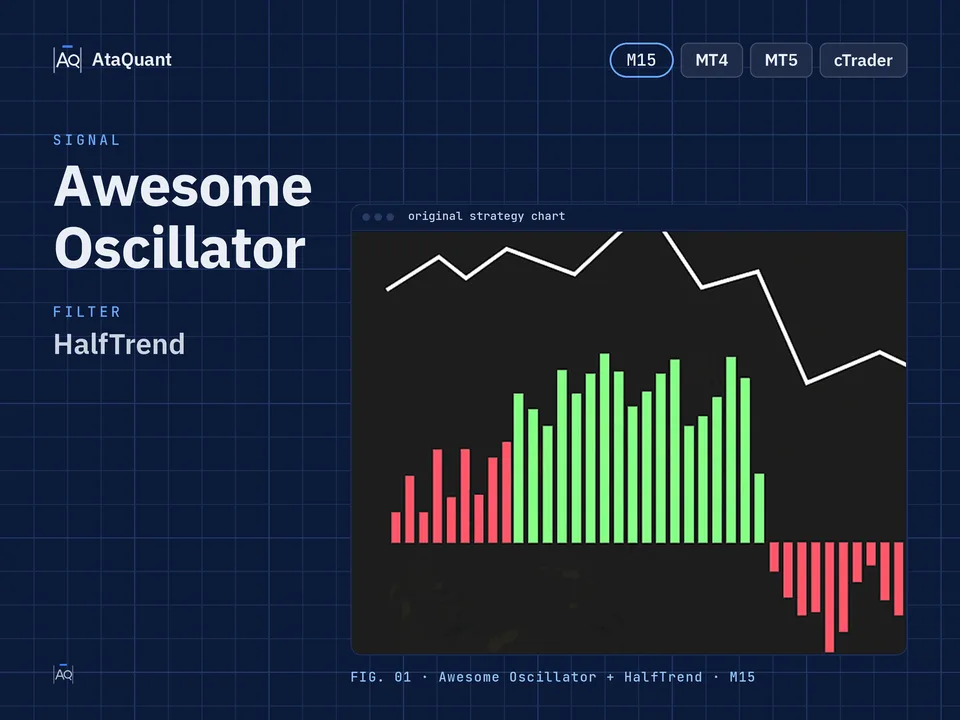
The second condition- The histogram of the Awesome oscillator should be above the zero line, and the color of its bars should be green.
The third condition – The CMF indicator should be greater than zero.
By establishing these three conditions, we purchase assets.
Stop Loss: We consider the closest support after establishing the conditions as the stop loss.
Target or take profit: The profit of this trade is based on risk-to-reward, and the ratio of risk to reward can include one of the following, according to the riskiness of the trader:
1- One-to-one risk-to-reward (low-risk)
2- Risk to reward is one to one and a half (moderate risk)
3- Risk to reward one to two (high-risk)

How to open a short position using this strategy
The following conditions must be met to complete the short trade:
The first condition – In the Stochastic RSI indicator, the blue line crosses the horizontal line of 80 downwards.
The second condition- The histogram of the Awesome oscillator should be below the zero line, and the color of its bars should be red.
The third condition – The CMF indicator should be less than zero.
By establishing these three conditions, we open a short position.
Stop Loss: We consider the closest resistance after establishing the conditions as the stop loss.
Target or take profit: The profit of this trade is based on risk-to-reward, and the ratio of risk to reward can include one of the following, according to the riskiness of the trader:
1- One-to-one risk-to-reward (low-risk)
2- Risk to reward is one to one and a half (moderate risk)
3- Risk to reward one to two (high-risk)

Note: The recommended time frame to use this strategy is 15 minutes.
The EA for this strategy
The rules above, coded as a ready-made Expert Advisor. See its inputs and platforms, or ask for a modification.