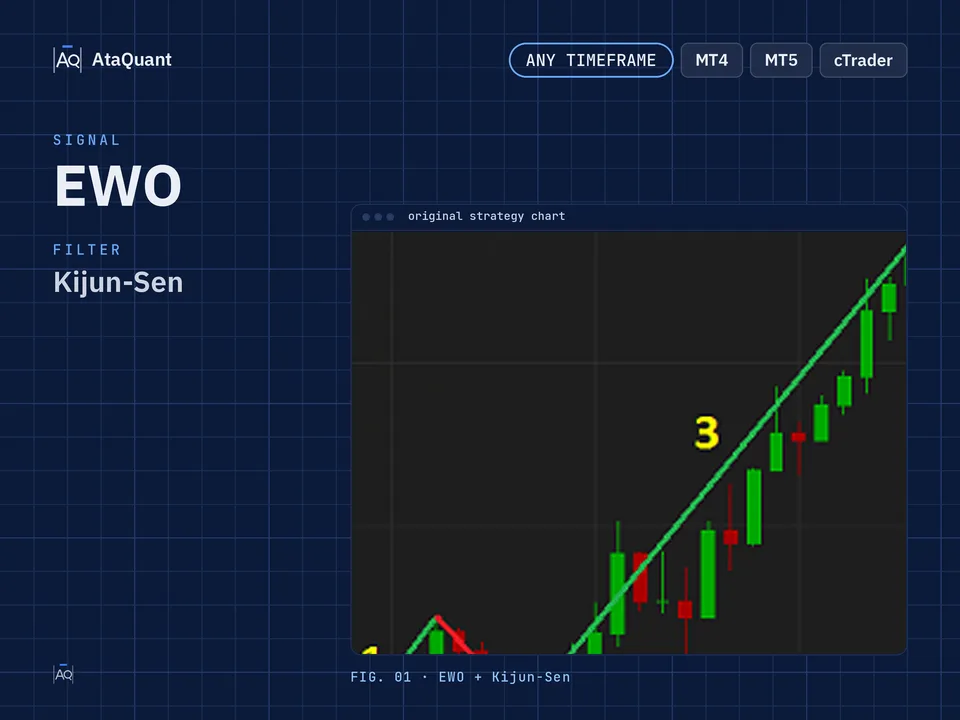
Trading strategy with the Elliot Wave Oscillator indicator
Boost your trading results with the Elliot Wave Oscillator Strategy — a powerful setup combining Elliot Wave Oscillator, EMA 100, and Kijun-Sen. Optimized for short- and medium-term trading, it helps traders achieve accurate entries and consistent profits.

Ready-made EA for this strategy is provided below — scroll to purchase
◊ Introduction to the EWO & Kijun-Sen Trading Strategy
This trading strategy is designed to identify strong market trends and take advantage of price direction changes. To increase signal accuracy, it uses a combination of Elliot Wave Oscillator, EMA 100, and Kijun-Sen to systematically confirm market trends and support/resistance levels. This approach allows traders to enter long or short positions with greater confidence and improve overall trade management.
◊ Indicators Used
Apply the EWO Indicator as the basis of trend detection
The Elliot Wave Oscillator (EWO) indicator is a widely used trend detection indicator that calculates the difference between the 5-period and 35-period simple moving average (SMA) based on the close of each candle.
If the price is in an uptrend and this uptrend is stronger than the previous 35 candles, the EWO will be positive, and if the price is in a downtrend and this downtrend is stronger than the last 35 candles, the EWO will be negative.
Therefore, changing the color of the histogram of this indicator is a buy or sell signal. In this way, if its histogram changes from red to green, it indicates an upward trend and a buy signal, and if its histogram changes from green to red, it means a downward trend and a sell signal.

Like all indicators, this indicator cannot be used exclusively as a trading strategy, because sometimes it sends wrong signals. To get rid of these false signals, we use the following two indicators to detect the trend, and if the trading signals are detected in the same direction as the trend, we trade them. These indicators are:
Use the EMA100 Indicator
If the price is above EMA 100, the market trend is upward, and if the price is below EMA 100, the market trend is downward.

Use the Kijun-Sen Indicator
If the price is above Kijun-Sen, it is an upward trend, and if the price is below Kijun-Sen, it is a downward trend.

Learn more:
1- Learn a 5-Min Scalping Strategy with MACD, RVI, and EMA Indicators
2- SSL, WAE, and EMA Trading Strategy
◊ The trading time frame of this strategy
The recommended time frame for using this strategy is more than 3 minutes.
◊ Inserting indicators in TradingView
Inserting the Elliot Wave Oscillator in TradingView
To insert in the trading wave environment, search for the Elliot Wave Oscillator from the indicators section and activate it on your chart, as shown in the image below. The author of this indicator is koryu.

Inserting the Kijun-Sen indicator in TradingView
To insert it, search for the term Kijun-Sen and select the Kijun-Sen indicator, whose author is Erwin Beckers, as shown below.

◊ Settings of indicators
EMA Indicator settings
Set its period length to 100.

Kijun-Sen and EWO Indicators settings
The settings of the Kijun-Sen indicator and Elliot Wave Oscillator are the same as the default settings.
Learn more:
1- VuManChu Swing and EMA trading strategy
2- Enhancing Trading Success with the Stochastic and EMA Strategy
Want to Automate this Strategy? Check out Ready-Made Expert Advisor here
◊ How to open a long position for using the EWO & Kijun-Sen Setup
● Entry Rules
To make a long trade, the following conditions must be met:
The first condition is that the price should be above the EMA100.
The second condition - the histogram of the Elliot Wave Oscillator indicator changes from red to green.
The third condition is that the price is higher than the Kijun-Sen.
By establishing these three conditions, we open a long position.
●Exit Rules
Stop Loss: Take the closest support as a stop loss.
Target or take profit: The profit of this trade is based on risk-to-reward, and the ratio of risk to reward can include one of the following, according to the riskiness of the trader:
1- One-to-one risk-to-reward (low-risk)
2- Risk to reward is one to one and a half (moderate risk)
3- Risk to reward one to two (high-risk)

◊ How to open a short position for using the EWO & Kijun-Sen Setup
● Entry Rules
The following conditions must be met to complete a short trade:
The first condition is that the price should be below the EMA100.
The second condition - the histogram of the Elliot Wave Oscillator indicator changes from green to red.
The third condition is that the price is lower than Kijun-Sen.
By establishing these three conditions, we open a short position.
●Exit Rules
Stop Loss: Consider the nearest resistance as the stop loss.
Target or take profit: The profit of this trade is based on risk-to-reward, and the ratio of risk to reward can include one of the following, according to the riskiness of the trader:
1- One-to-one risk-to-reward (low-risk)
2- Risk to reward is one to one and a half (moderate risk)
3- Risk to reward one to two (high-risk)

Note: The time frame for using this strategy is more than 3 minutes.
Conclusion
Using the Elliot Wave Oscillator in combination with EMA 100 and Kijun-Sen helps traders accurately identify market trends while reducing the risk of false signals. By following the entry and exit conditions and applying an appropriate risk-to-reward ratio, traders can manage short- or medium-term trades more effectively. This strategy provides a structured and systematic approach for trading in volatile markets.
Looking for more? Discover our other forex trading strategies and see how they can fit your trading style.
All-in-one trading resources.
From free custom indicators to ready-to-use Expert Advisors, we provide everything you need to trade smarter. Got your own idea? Let us build a tailored EA that follows the rules of your strategy.
Visit our Expert Advisor Shop
Check out our Free Indicators here
The EA for this strategy
The rules above, coded as a ready-made Expert Advisor. See its inputs and platforms, or ask for a modification.