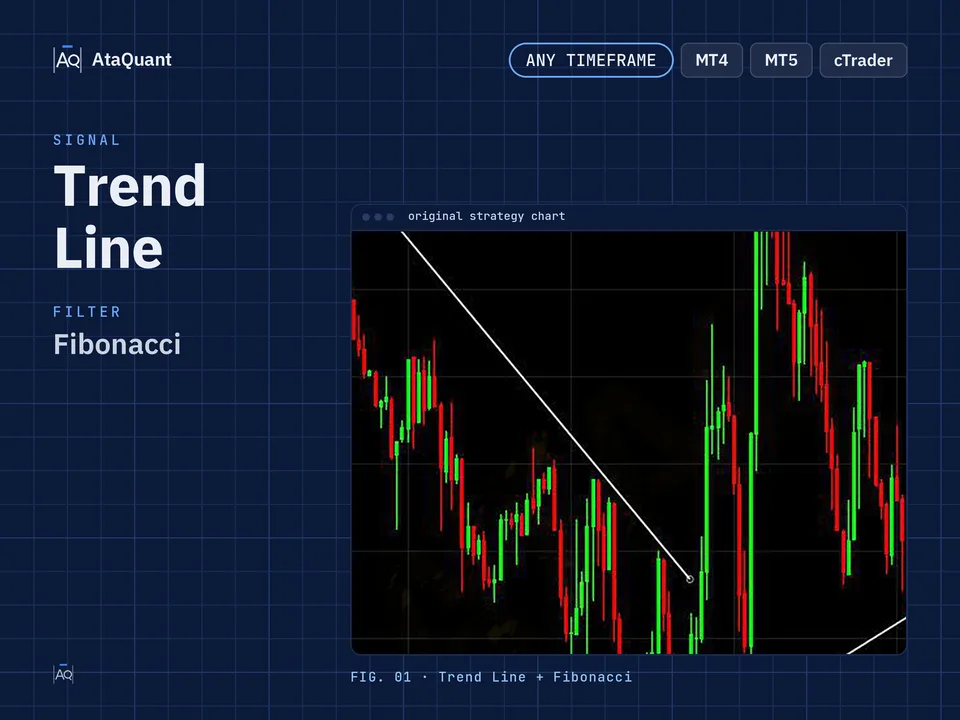
Strategies for Trading with Trend Lines: Fibonacci Retracement, Moving Averages, and Candlestick Patterns
Boost your trading results with the Trend Line Strategy — a powerful setup combining Fibonacci Retracement, Moving Averages, and Candlestick Patterns. Optimized for trend trading, it helps traders achieve accurate entries and consistent profits.

Ready-made EA for this strategy is provided below — scroll to purchase
◊ Introduction to the QQE MOD & Range Filter Trading Strategy
The trend line is a simple yet powerful tool utilized by traders. In the following, we will define the Trend Line and discuss some points for drawing it. Additionally, you will learn three powerful Trend Line trading strategies.
Two Minutes with the Trend Line Strategy
In this episode of Strategy Bites, we explore trading with Trend Lines using three practical approaches: bounce setups, breakout entries, and confirmation with Fibonacci, moving averages, and candlestick patterns. A quick audio recap for applying trend lines in real trades.
◊ What is a Trend Line?
A trend line is a straight line drawn on price charts to show the trend and direction of price movement. Traders use these lines to determine buying or selling opportunities in line with the trend.
Trend Lines are one of the most recognized technical analysis tools used in various financial markets, such as the stock market, forex currency pairs, or digital currencies.
◊ How does a Trend Line work?
The classical method for drawing a Trend Line involves connecting a series of peaks or troughs with a straight line.
An uptrend line is drawn by connecting the troughs, whereas a downtrend line is drawn through the peaks. In this method, the trend line acts as a support level in an uptrend and a resistance level against a downtrend. Trend lines are commonly called "dynamic support and resistance" because they move with the price trend.

◊ How do we draw a Trend Line?
To draw a Trend Line, start from the left side of the chart and draw the line towards the right. The general rule is that a Trend Line should connect at least three oscillations (peaks or troughs) in price to be considered valid.
A- For drawing an uptrend line, start with a trough on the left side of the chart and connect it to a higher trough.
B- For drawing a downtrend line, start with a peak on the left side of the chart and connect it to a lower peak.
◊ Key Factors to Consider When Using a Trend Line
1- Is there a trend?
A common mistake most beginners make is using a trend line when there is no actual trend. Looking at the chart below, you can see that the market is just moving. So, it's no surprise that not all of these trend lines work.

2- Trend Line angles
Some platforms have tools that show the angle of a Trend Line. In MT4 (Metatrader 4), this is known as "Trend Line by Angle." An excellent Trend Line has an angle of approximately 45 degrees.
More than 45 degrees indicates that the price is rapidly increasing and may easily break the Trend Line, even if the trend continues.
Less than 45 degrees suggests a weak trend that cannot be relied upon.
3- Number of touches
The more touches a Trend Line has, the stronger it becomes as it becomes more recognizable to traders. However, the probability of "breaking" the trend line increases significantly with more than five touches.
4- Zoom out
Remember to zoom out on your chart in your trading platform to see the start of the trend you want to show with the Trend Line. For example, if you're drawing an uptrend, find the lowest previous downtrend and start your Trend Line there.
5- Trend Zone
A Trend Line is not an exact science! It is rare for the price to touch a Trend Line precisely and then reverse.
Trend Lines should be considered a "zone" rather than an exact price point. Understanding this helps with determining entry price and stop-loss levels.

◊ Strategies for Trading with Trend Lines
There are various ways to utilize Trend Lines in trading, but here we will explain two common trading strategies using Trend Lines and a lesser-known but highly effective third option.
1) Trend Line Strategy
In this strategy, the goal is to profit from a trend supported by a trend line. It involves buying near an ascending Trend Line or selling near a descending Trend Line.
Here are the steps for the strategy:
1- Determine the price trend: Upward, downward, or ranging.
2- Draw a Trend Line with at least three points (peaks or valleys) according to the above rules.
3- Extend the Trend Line into the future.
4- Wait for the price to touch the Trend Line at another point.
5- Set a limit order on the Trend Line (adjust it with the price movement).
6- Enter the trade in the direction of the trend when the price touches the Trend Line.
7- Place a stop loss below the previous valley in an uptrend (or above the previous peak in a downtrend).
8- The take profit (TP) is set at a 1:2 ratio (twice the distance from the stop loss to the entry point) [1:2].

2. Trend Line Breakout Strategy
A Trend Line breakout can be used as a trading setup until it occurs in the direction of the bigger trend.
Strategy Steps:
1. Start by drawing the long-term Trend Line.
2. Wait for the price to "correct" or move against the long-term trend.
3. Draw a short-term Trend Line for this correction.
4. Wait for the price to cross or break the short-term Trend Line.
5. You can enter a trade in the direction of the larger trend.
6. Place your stop loss on the opposite side of the Trend Line.
7. The take profit (TP) is set at a 1:2 risk-reward ratio (twice the distance between the stop loss and entry point). [1:2]

3. Trend Lines Strategy with an entry confirmation
Although trend lines are powerful tools, but no perfect technical indicator or trading system, so you should always use multiple analysis techniques and wait for opportunities where all methods converge to increase the likelihood of success in a trade. Therefore, the more confirmations you have before entering, the more likely you will be successful.
Want to Automate this Strategy? Check out Ready-Made Expert Advisor here
Pay attention to the following examples:
1- Trend Lines can be combined with Fibonacci retracement levels for confirmation.
In this example, a buying opportunity in an uptrend is confirmed when the price retraces to the Fibonacci retracement level of 61.8%.

2- Combination of trend lines with moving average
Here, the rising Trend Line aligns with the 200-day moving average, indicating a bullish trend.

3- Combination Trend lines with candlestick patterns
Here, the upward Trend Line is confirmed by bullish candlestick patterns.

◊ Conclusion
Trend Lines are among the most fundamental yet versatile tools in technical analysis. When drawn correctly and applied within a clear market trend, they provide traders with dynamic support and resistance levels that can help define high-probability entry and exit points. However, as powerful as they are, Trend Lines should never be used in isolation.
In this article, we explored three practical approaches: trading direct Trend Line reactions, trading breakout setups within the direction of the larger trend, and enhancing Trend Line signals with additional confirmation tools. By combining Trend Lines with Fibonacci retracement levels, moving averages, and candlestick patterns, traders can significantly increase the reliability of their setups and reduce false signals.
Successful trading is not about relying on a single indicator, but about building confluence — where multiple analytical tools align to support a trading decision. When Trend Lines are used as part of a structured strategy with proper risk management, such as maintaining a consistent 1:2 risk-reward ratio, they become a powerful component of a disciplined trading plan.
With the right analysis, confirmation, and execution, Trend Lines can transform from simple chart drawings into a strategic framework for consistent trading performance.
Looking for more? Discover our other forex trading strategies and see how they can fit your trading style.
All-in-one trading resources.
From free custom indicators to ready-to-use Expert Advisors, we provide everything you need to trade smarter. Got your own idea? Let us build a tailored EA that follows the rules of your strategy.
Visit our Expert Advisor Shop
Check out our Free Indicators here
The EA for this strategy
The rules above, coded as a ready-made Expert Advisor. See its inputs and platforms, or ask for a modification.