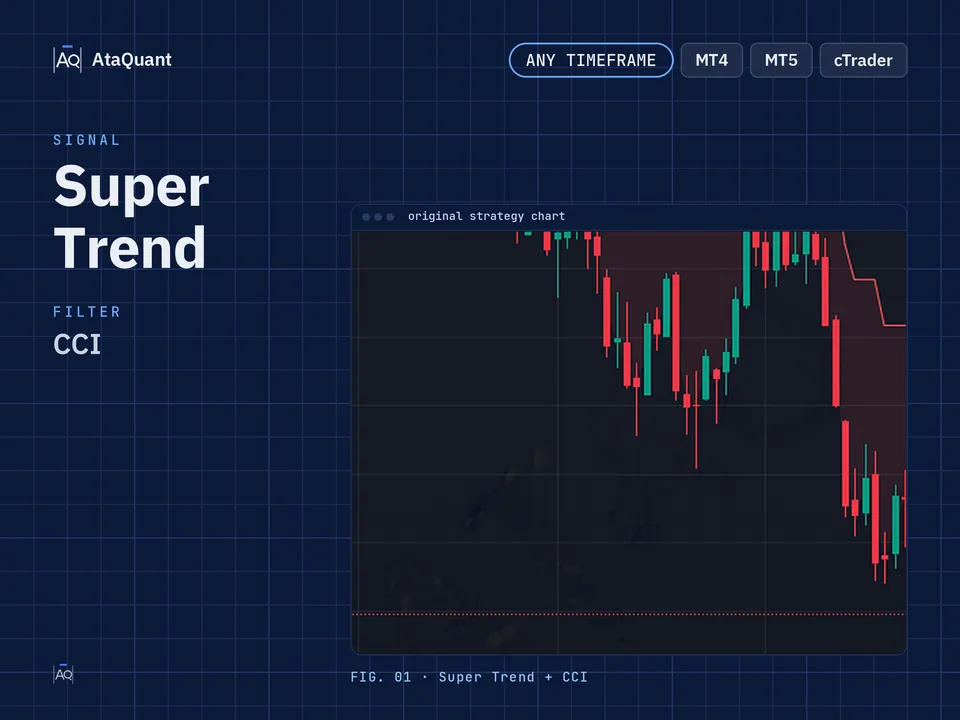
The SuperTrend, SMA 200, and the Coppock Curve: A Trend-Based Trading Approach
You will earn significant profits if you correctly identify the market's direction and trade in the trend. One of the most popular trend detection tools is the Super Trend Indicator. This indicator employs two distinct colors, green and red, to represent the direction of the trend.

One of the most popular trend detection tools is the Super Trend Indicator. This indicator employs two distinct colors, green and red, to represent the direction of the trend. When the line changes to red, it signifies a downward trend, while green signals an upward trend. Also, in addition to identifying the trend, Super Trend issues buy and sell signals.

In this strategy, our approach does not rely solely on the Super Trend indicator. Instead, we incorporate the Super Trend with other indicators to filter out false signals. These indicators are:
1- SMA 200 indicator, which we use to determine the direction of the market trend. When the price is above the SMA 200, it signifies an upward trend, whereas if the price is below the SMA 200, it indicates a downward trend.
In this strategy, we trade only a buy signal when the price is above the SMA200. Conversely, we exclusively consider sell signals when the price is below the SMA200.
2- Coppock Curve indicator: This indicator generates buy and sell signals, and interpreting its signals is straightforward. The Coppock Curve indicator comprises two distinct areas - one negative and one positive, with a zero line demarcating both. When the curve transitions from negative to positive territory, it indicates a buy signal. Conversely, when the positive curve transitions back to negative territory, it signals a sell opportunity.

Learn more:
1- Effective Trading Technique with SuperTrend Signals
2- Super trend and CCI trading strategy
The trading time frame of this strategy
The recommended time frame for using this strategy is more than 3 minutes.
Inserting indicators in the trading view
Insert Coppock Curve indicator: To insert this indicator, in the trading view environment, search for the term Coppock Curve from the indicators section and activate it on your chart, as shown in the image below. Make sure that the author is everget.

Settings of indicators
The settings of the indicators are the same as the default settings; just set the period length to 200 in the SMA indicator in the Inputs section, as shown in the image below.

Learn more:
Supertrend and Base Line Ichimoku trading strategies
How to open a long position using this strategy
To make a long trade, the following conditions must be met:
First condition- The price should be above the SMA 200.
The second condition- Supertrend issues a buy signal.
The third condition- The Coppock Curve indicator should change from red to green and be above the middle line (zero).
Stop Loss: We consider the closest support as the stop loss.
Target or take profit: The profit of this trade is based on risk-to-reward, and the ratio of risk to reward can include one of the following, according to the riskiness of the trader:
1- One-to-one risk-to-reward (low-risk)
2- Risk to reward is one to one and a half (moderate risk)
3- Risk to reward one to two (high-risk)

How to open a short position using this strategy
The following conditions must be met to complete the short trade:
The first condition- The price should be lower than the SMA 200.
The second condition- Supertrend issues a sell signal.
The third condition- The Coppock Curve indicator should change from green to red and be above the middle line (zero).
Stop Loss: We consider the closest resistance as the stop loss.
Target or take profit: The profit of this trade is based on risk-to-reward, and the ratio of risk to reward can include one of the following, according to the riskiness of the trader:
1- One-to-one risk-to-reward (low-risk)
2- Risk to reward is one to one and a half (moderate risk)
3- Risk to reward one to two (high-risk)

Note: The recommended timeframe for this strategy is more than 3 minutes.
This strategy can be converted into an Expert Advisor (trading robot)
Our team is ready to design and develop a custom Expert Advisor for this strategy with the highest precision and in the shortest possible time. Feel free to contact us to submit your request or receive a consultation.

The EA for this strategy
The rules above, coded as a ready-made Expert Advisor. See its inputs and platforms, or ask for a modification.