Top Indicators for Detecting Divergence
You can identify times to buy or sell stocks by spotting divergence at the right time. Divergence occurs when the price chart and indicator chart are in opposite directions. Divergences are divided into two general categories, regular and hidden divergence, and each is divided into two subcategories, positive and negative.

Definition of divergence and its types:
Divergence occurs when the price chart and indicator chart are in opposite directions. Divergences are divided into two general categories, regular and hidden divergence, and each is divided into two subcategories, positive and negative.

In the previous article, we explained the concept of divergence with an example. Click here to read it.
Divergence detection indicators
Now that you are familiar with the concept of divergence, we will introduce you to 7 indicators for detecting divergence.
1- RSI Indicator
The RSI indicator (relative strength index) is one of the most potent and efficient tools for predicting the market oscillates between two specific intervals. This indicator can show the trader the overbought and oversold areas to find a good point to enter the trade.
The RSI chart is a line that shows values between 0 and 100 and oscillates between two lower bands (from 0 to 30) and an upper band (70 to 100). Whenever this graph is in the upper band, we say that the market is overbought, and if it is in the lower band, we say that the market is oversold.
How to detect divergence using the RSI indicator
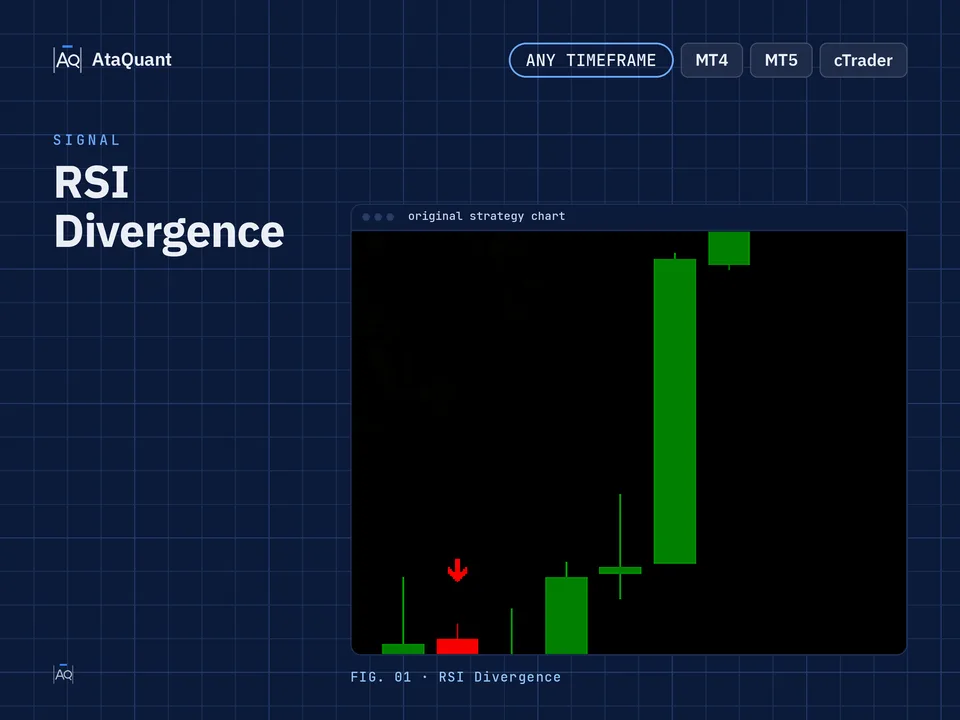
When a new support or resistance level is established on the RSI chart, it is compared to the price chart. If a discrepancy is observed in the price movement, it suggests the presence of potential divergence. Please refer to the figure below for a visual representation.

2- MFI Indicator
The MFI indicator, which stands for Money Flow Index, collects data and information related to price and volume and shows the cash flow index for a share.
This indicator is very similar to the RSI indicator and is commonly called the volume RSI. Like RSI, its values range from 0 to 100 and are divided into upper bands, indicating overbought conditions, and lower bands, representing oversold conditions. In the Money Flow Index (MFI), the lower band ranges from 0 to 20, indicating selling saturation, while the upper band ranges from 80 to 100, indicating buying saturation.
How to detect divergence using the MFI indicator
When a new support or resistance level is formed on the MFI chart, it is compared to the price chart. If a contrasting movement is noticed, it indicates a potential occurrence of divergence. Please refer to the figure below for a clearer understanding.

3- Momentum Indicator
Another indicator used for identifying divergence is the Momentum indicator, which measures the velocity of price changes and aids in forecasting market trends. By comparing the current price with the past, it measures the acceleration of price growth or decline and displays it as a linear graph.
How to detect divergence using the Momentum indicator
Similar to other indicators, when a new support or resistance level is formed, it is compared to the price chart. If there is a contrasting movement in the price, it indicates a potential occurrence of divergence.
The rules for detecting divergences using the Momentum indicator are like those of other indicators. As in the figure below

4- Stochastic Indicator
Stochastic is an indicator that determines the speed (momentum) and strength of price movements. Stock values are always between 0 and 100, which, like the MFI indicator, has two bands: 0 to 20 for oversold and 80 to 100 for oversold.
How to detect divergence using the Stochastic indicator
The stochastic indicator is a widely used indicator for detecting divergence.
Whenever you see a conflict between the indicator and the price, there is a high probability of divergence.

5- OBV Indicator
OBV (the volume index on balance) is an abbreviation of On Balance Volume. Helps market analysts to identify the trend by using volume flow. This is a technical momentum indicator that measures buying or selling pressure of a stock and visualizes it in a graphical format.
Divergence detection by the OBV indicator
Divergence arises when there is a discrepancy between the behavior of the OBV chart and the price chart. The types of OBV divergences are analogous to other indicators. Please refer to the example image below for visual representation.

6- MACD Indicator
The MACD indicator is a momentum oscillator usually used to detect trends. The MACD indicator expresses the relationship between two moving averages of asset prices.
The MACD indicator is used in technical analysis to obtain strength, direction, and momentum in a trend. The MACD indicator consists of two MACD and SIGNAL lines and a histogram.
Divergence detection by the MACD indicator
To detect divergences, we pay attention to the cross between these two lines using MACD and compare it with the formation of peaks and valleys in MACD with the price chart, and if there is a behavioral conflict between MACD and price, there will probably be a divergence.

7- CCI Indicator
The CCI indicator is the last indicator we introduced in divergence detection. This indicator (the Commodity Channel Index) calculates the value of the difference between the current price and the historical average price. It points to the time of overbought or oversold of an asset and can be used to provide trading signals.
Divergence detection with the CCI indicator
As with all the indicators we have reviewed so far, in CCI, we look for the contrast between the indicator chart and the price chart to detect divergence.

Identifying different types of divergences by the above indicators
A- Positive Regular Divergence
This occurs when the indicator forms a higher low, but the corresponding point on the price chart forms a lower low. In such cases, we observe a Positive Regular Divergence, indicating an expectation of price reversal.
B- Negative Regular Divergence
This occurs when the indicator forms a lower high, but the corresponding point on the price chart forms a higher high. In such cases, we observe a Negative Regular Divergence, indicating an expectation of price reversal.
C- Positive Hidden Divergence
In this scenario, the indicator forms a lower low, but the price chart forms a higher low. Positive Hidden Divergence suggests anticipation of the upward trend to persist.
D- Negative Hidden Divergence
In this case, the indicator forms a higher high, but the price chart forms a lower high. Negative Hidden Divergence indicates an expectation of the continuation of the downward trend.
The EA for this strategy
The rules above, coded as a ready-made Expert Advisor. See its inputs and platforms, or ask for a modification.