Trading with the G TREND GUNBOT Indicator: Mastering Market Trends
Boost your trading results with the G-Trend Gunbot Strategy — a powerful setup combining G-Trend Gunbot, Williams %R, and EMA 200. Optimized for 3-minute+ trading, it helps traders achieve accurate entries and consistent profits.

Ready-made EA for this strategy is provided below — scroll to purchase
◊ Introduction to the G-Trend Gunbot Strategy
G-Trend Gunbot is an innovative indicator that provides traders with valuable insights into market trends and potential trading opportunities. Developed with advanced algorithms and data analysis, this indicator utilizes Google Trends data to gauge the popularity and interest in specific keywords or topics related to financial markets. By tracking the search volume and sentiment associated with these keywords, G-Trend Gunbot helps traders identify emerging trends, changes in market sentiment, and potential entry or exit points for their trades. With its user-friendly interface and real-time data updates, G-Trend Gunbot empowers traders with a unique perspective on market dynamics, enhancing their decision-making process and trading strategies.
In this post, we intend to share a strategy based on this indicator with you. So stay with AtaQuant until the end.
Two Minutes with the G-Trend Gunbot Strategy
The audio version of the G-Trend Gunbot strategy is here—a quick and compact recap you can listen to in just two minutes. If reading the full text feels time-consuming, or you just want to catch the key points, this podcast is a quick option.
◊ How does the G-Trend Gunbot indicator work?
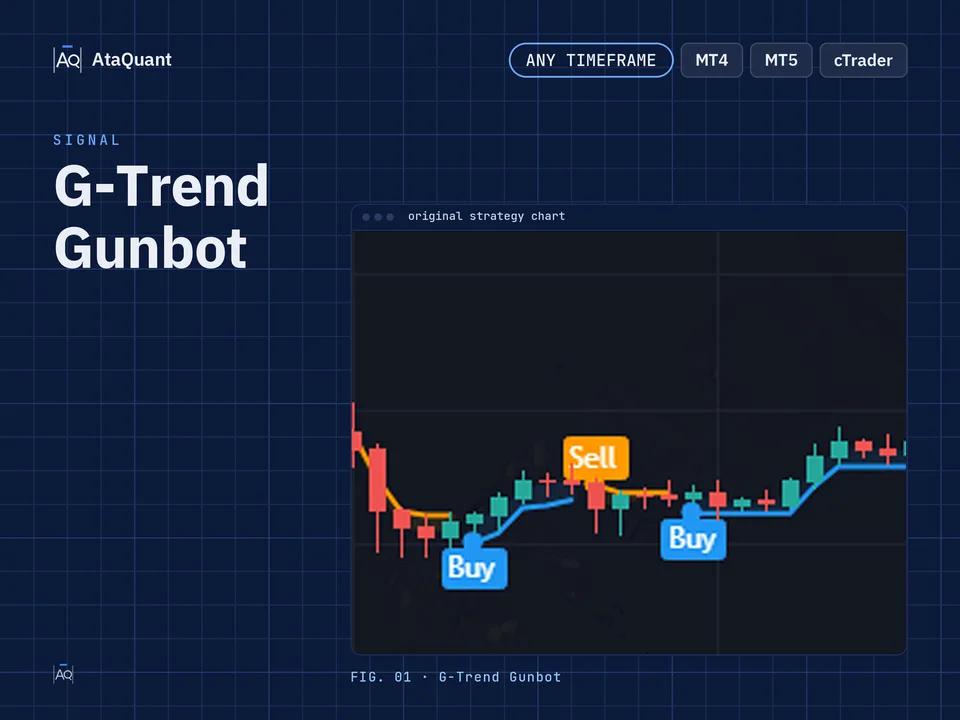
The G TREND GUNBOT indicator is an analytical tool used to identify market trends and find suitable entry and exit points for trading. By analyzing market price and volume data, this tool assists users in making better decisions regarding buying or selling their assets. This indicator shows the current market trend by drawing blue and orange lines. If the indicator is blue, it indicates an uptrend, while if it is orange, it signifies a downtrend.

◊ Indicators Used
Whenever the G TREND GUNBOT indicator changes color from blue to orange, it generates a sell signal, and when it changes from orange to blue, it generates a buy signal. This indicator works best in trending markets.
But this indicator tends to produce frequent false signals in non-trending or neutral markets. Therefore, two additional indicators are used alongside the G TREND GUNBOT indicator to minimize false signals. These indicators are:
1. Williams %R Indicator: Used to confirm entry into a trade.
2. EMA 200 Indicator: Used to identify the market trend.

◊ In what time frame should the G-Trend Gunbot indicator be used?
You can use this strategy at any time frame, but to avoid false signals, it is recommended to use a time frame longer than 3 minutes.
◊ Adding the indicators in the Trading View:
To add the G TREND GUNBOT indicator in the TradingView platform, go to the "Indicators" section in the TradingView chart and search for the phrase "G TREND" as shown in the image below. The author of this indicator is LUIS_GANDARA_G_TREND.
Remember to use the G TREND GUNBOT indicator alongside the Williams %R and EMA 200 indicators.

◊ Settings of indicators
Williams %R Indicator settings
Williams %R Indicator: Use the default settings provided by the indicator.
G-Trend Gunbot Indicator settings
G TREND Indicator: Adjust the following values to the specified numbers:
ATR Period: 20
ATR Multiplier: 5
These settings are recommended for the G TREND indicator in this strategy. Note that these settings can be customized based on your preferences and trading style.

EMA Indicator settings
For the EMA (Exponential Moving Average) indicator, you will set the period length to 200. This means you will calculate the EMA based on the last 200 periods of data. Adjust the settings of the EMA indicator accordingly in your trading platform.

Want to Automate this Strategy? Check out Ready-Made Expert Advisor here
◊ How to open a long position using the G-Trend Gunbot Setup
● Entry Rules
To open a long position using the G TREND GUNBOT Indicator, the following conditions need to be met:
Condition 1: The G-Trend indicator generates a buy signal.
Condition 2: Wait for the Williams %R indicator to enter the oversold zone, meaning it drops below -80, and then exits that zone.
Condition 3: The price should be above the EMA 200.
Once these conditions are satisfied, you can open the long position.
Of course, keep in mind that by meeting the above three conditions, if the G TREND indicator is still blue, we proceed with buying the asset.
●Exit Rules
Stop Loss: We consider the G TREND indicator as the stop loss level for this trade.
Take Profit: The profit target for this trade is based on the risk-to-reward ratio, which can be one of the following options depending on the trader's risk tolerance:
1- Risk-to-reward ratio 1:1 (low-risk)
2- Risk-to-reward ratio 1:1.5 (moderate risk)
3- Risk-to-reward ratio 1:2 (high-risk)

◊ How to open a short position using the G-Trend Gunbot Setup
● Entry Rules
To open a short position using the G TREND GUNBOT Indicator, the following conditions need to be met:
Condition 1: The G-Trend indicator generates a sell signal.
Condition 2: Wait for the Williams %R indicator to enter the overbought zone, meaning it rises above -20, and then exits that zone.
Condition 3: The price should be below the EMA 200.
By meeting the above three conditions, if the G TREND indicator is still orange, we will proceed to sell the asset.
●Exit Rules
Stop Loss: We consider the G TREND indicator as the stop loss level for this trade.
Take Profit: The profit target for this trade is based on the risk-to-reward ratio, which can be one of the following options depending on the trader's risk tolerance:
1- Risk-to-reward ratio 1:1 (low-risk)
2- Risk-to-reward ratio 1:1.5 (moderate risk)
3- Risk-to-reward ratio 1:2 (high-risk)

◊ Conclusion and Important Points
1- Under no circumstances should you execute real trades without practicing and repeating this strategy in a demo account or by reviewing historical charts.
2- Adhere strictly to all the rules and conditions mentioned, and only open trades when all the terms of the strategy are met.
3- The optimal timeframe for using this strategy is more than 3 minutes.
4- Please note that determining the appropriate risk-to-reward ratio should be based on your trading preferences and risk management strategy.
5- In both types of transactions (buying and selling), it's important to note that trade execution and risk management should match your personal trading strategy and risk tolerance.
It's significant to thoroughly understand and practice any trading strategy before applying it with real money. Using a demo account or backtesting on historical data can help you gain confidence and familiarize yourself with the strategy's outcomes. Always prioritize risk management and adapt the strategy to suit your trading style and risk tolerance.
Looking for more? Discover our other forex trading strategies and see how they can fit your trading style.
Turn your trading idea into reality!
No matter what strategy you have in mind, we can develop a custom Expert Advisor tailored to your needs. Prefer ready-made solutions? Explore our EA Shop and start trading instantly.
Visit our Expert Advisor Shop
Check out our Free Indicators here
The EA for this strategy
The rules above, coded as a ready-made Expert Advisor. See its inputs and platforms, or ask for a modification.