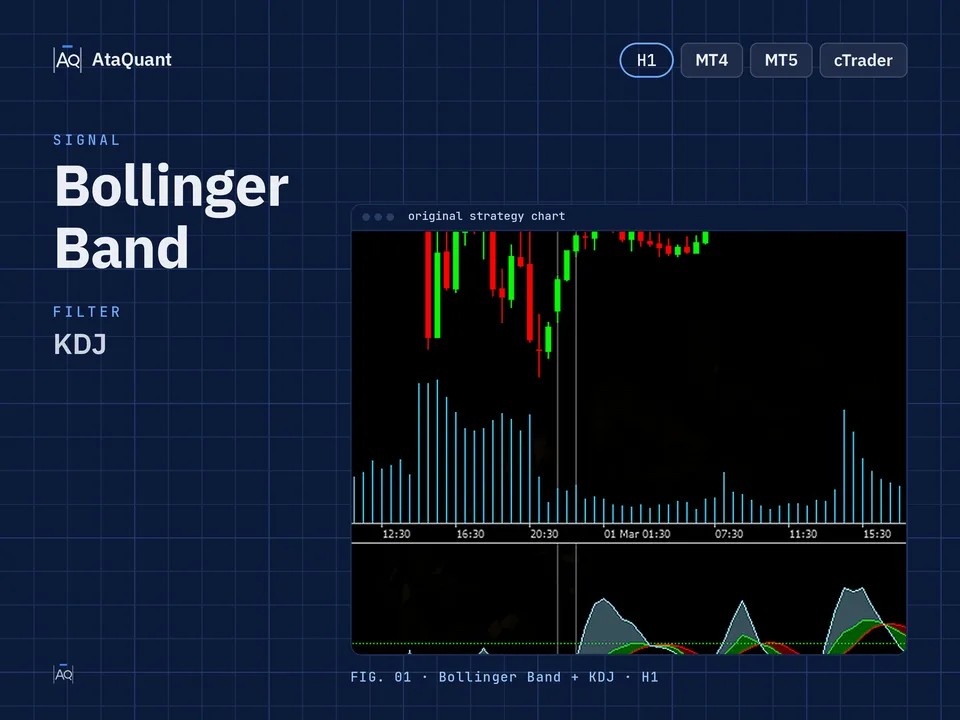
Bollinger Band and KDJ trading strategy
Boost your trading results with the Bollinger Band & KDJ Strategy — a powerful setup combining Bollinger Bands, KDJ_Colintse, and EMA 200. Optimized for 1-hour trading, it enhances accurate entries and consistent trend-following profits.

Ready-made EA for this strategy is provided below — scroll to purchase
◊ Introduction to the Bollinger Bands Trading Strategy
In the ever-changing world of financial markets, identifying precise entry and exit points is one of the biggest challenges for traders. The Bollinger Band indicator, known for its ability to reflect price volatility, remains one of the most popular tools in technical analysis.
In this strategy, we combine Bollinger Bands with two additional indicators — KDJ_Colintse and EMA 200 - to build a simple yet highly effective trading system. This combination helps filter out false signals and provides more reliable trading opportunities. In the following guide, you’ll learn step-by-step how to set up these indicators and apply the strategy in your trading.
◊ Indicators Used
Apply the Bollinger Bands Indicator
Various strategies have been developed using the Bollinger Bands indicator, one of which is the trading signals issued by exiting the band and re-entering the band.
The basis for entering the trade in this strategy is exiting and re-entering the Bollinger bands. Since using this strategy alone gives false signals, we use two other indicators to confirm the entry. These indicators are:
Use the KDJ_Colintse Indicator
We use this indicator to confirm entering the trade.
Use the EMA200 Indicator
We use EMA 200 to identify the market trend and trade in the direction of the trend.

Learn more:
1- CCI and Bollinger Band trading strategy
2- SSL, WAE, and EMA Trading Strategy
◊ The trading time frame of this strategy
Although this strategy can be used in all time frames, the recommended time frame to use this strategy is one hour.
◊ Inserting indicators in TradingView
Inserting the KDJ_Colintse indicator in TradingView
To insert the KDJ_Colintse indicator, search for the term KDJ_Colintse in the indicators section in the TradingView environment and activate it on your chart. Make sure that the author of this indicator is Ee20.

◊ Settings of indicators
Bollinger Bands Indicator settings
To improve the visibility of this indicator, navigate to the STYLE section and deactivate the Basis and Background options, as illustrated in the image below.

KDJ_Colintse Indicator settings
In the INPUTS section, set the duration to 25

Apply the following changes in the STYLE section, as shown in the image below.

EMA Indicator settings
In the INPUTS section, we set the period to 200. Like the picture below

Learn more:
1-The Cross EMA Trading Strategy
2- VuManChu Swing and EMA trading strategy
Want to Automate this Strategy? Check out Ready-Made Expert Advisor here
◊ How to open a long position using the Bollinger Band and KDJ
● Entry Rules
To make a long trade, the following conditions must be met:
The first condition - The price closes below the lower Bollinger band.
Second condition – The KDJ indicator should be below the line 20.
The third condition - The price returns to the top of the lower Bollinger band.
The fourth condition – The KDJ indicator is above the 20 line but not above the 80 line.
The fifth condition - The price should be higher than the EMA 200.
By establishing these five conditions, we open a long position.
●Exit Rules
Stop Loss: We consider the lowest Low after establishing the conditions as the stop loss.
Target or take profit: The profit of this trade is based on risk-to-reward, and the ratio of risk to reward can include one of the following, according to the riskiness of the trader:
1- One-to-one risk-to-reward (low-risk)
2- Risk to reward is one to one and a half (moderate risk)
3- Risk to reward one to two (high-risk)

◊ How to open a short position using the Bollinger Band and KDJ
● Entry Rules
The following conditions must be met to complete the short trade:
The first condition- The price closes above the upper Bollinger band.
The second condition - The KDJ indicator should be above the 80 line.
The third condition - The price returns to the bottom of the upper Bollinger band.
The fourth condition - The KDJ indicator should be below the 80 line but not below the 20 line.
The fifth condition - The price should be lower than the EMA 200.
By establishing these five conditions, we open a short position.
●Exit Rules
Stop Loss: We consider the highest high after establishing the conditions as the stop loss.
Target or take profit: The profit of this trade is based on risk-to-reward, and the ratio of risk to reward can include one of the following, according to the riskiness of the trader:
1- One-to-one risk-to-reward (low-risk)
2- Risk to reward is one to one and a half (moderate risk)
3- Risk to reward one to two (high-risk)

Tip: The recommended time frame to use this strategy is one hour.
Conclusion
The Bollinger Band and KDJ trading strategy is a well-balanced system that combines three powerful indicators to identify price reversals and confirm trade entries with higher accuracy. By following the defined entry and exit rules and considering the price position relative to EMA 200, traders can align with the overall market trend and minimize emotional decision-making.
As always, it’s recommended to test this strategy in a demo environment first and adjust the parameters according to your trading style before using it in live trading.
Looking for more? Discover our other forex trading strategies and see how they can fit your trading style.
Save time – automate your trades.
Why stick to manual trading when you can let automation work for you? We transform any strategy into a fully functional Expert Advisor. Or choose from our collection of ready-to-use EAs in the shop.
Visit our Expert Advisor Shop
Check out our Free Indicators here
The EA for this strategy
The rules above, coded as a ready-made Expert Advisor. See its inputs and platforms, or ask for a modification.