Trendline breakout trading strategy with Bollinger Bands
Boost your trading results with the Trendline Breakout Strategy using Bollinger Bands and Awesome Oscillator — a powerful setup optimized for 3-minute+ timeframes to enhance accuracy, improve entries, and support consistent profits.

Ready-made EA for this strategy is provided below — scroll to purchase
◊ Introduction to the Bollinger Bands Trading Strategy
The Bollinger Bands indicator is a widely used tool in technical analysis by traders and investors across financial markets. Comprising three lines, it features two upper and lower bands. When the price nears the upper band, it's often seen as overbought, while approaching the lower band suggests oversold conditions.
One of the trading strategies using Bollinger Bands is the Trend Reversal Strategy, which holds that whenever the price touches a band, it tends to return to the center or reverse the trend.

Learn more:
1- Integrating Stochastic RSI and Awesome Indicators
2- Super Bollinger Trend Trading Strategy
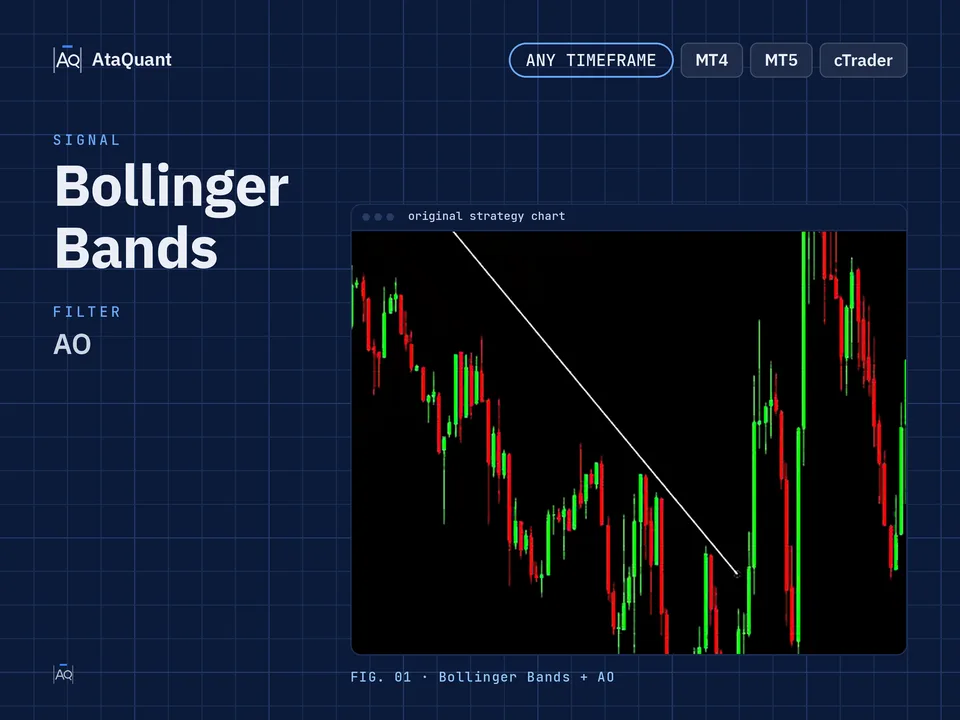
We use trendline analysis to optimize this strategy after the price hits the upper or lower band. In this way, whenever the price touches the lower band of Bollinger, we draw a downward trend line, and after breaking this trend line, we open a long position; whenever the price touches the upper band, we draw an upward trend line. And after its failure, we open a short position.
To reduce the false signals of this strategy, we use Awesome Oscillator along with Bollinger Bands. In this way, whenever the strategy in question issues a buy signal, we enter into a buy transaction if the histogram of the Awesome Oscillator changes color from red to green in the negative part, and the sell signal of the strategy is confirmed when the histogram in the positive part changes color from green to red.

Learn more:
1- Super Trend and Awesome Trading Strategy
2- Awesome oscillator trading strategy
◊ Indicators Used
1- Bollinger Bands Indicator
2- Awesome Oscillator
◊ The trading time frame of this strategy
The recommended time frame for using this strategy is more than three minutes.
◊ Settings of indicators
In this strategy, all the settings of the indicators should be the same as the default settings.
Learn more:
1- Bollinger Bands %B Trading Strategy
2- VuManChu Swing and Bollinger Band Trading Strategy
Want to Automate this Strategy? Check out Ready-Made Expert Advisor here
◊ How to open a long position for using the Bollinger Bands & Awesome Setup
● Entry Rules
To make a long trade, the following conditions must be met:
Step 1 - the price touches the lower Bollinger band and closes inside the band.
Step 2 – Draw a downtrend line using at least two peaks.
Step 3 - We wait until the trend line drawn by an ascending candle is broken.
Step 4 – The Awesome Oscillator indicator should change color from red to green in the negative part.
By establishing all the steps, we open a long position.
●Exit Rules
Stop Loss: We set the nearest support level before the trend line breaks as our stop loss.
Target or take profit: The profit for this trade is determined by a risk-to-reward ratio of one to one or one to two in high-risk scenarios. Alternatively, hitting the upper band of the Bollinger Bands is considered the profit target for the trade.

◊ How to open a short position for using the Bollinger Bands & Awesome Setup
● Entry Rules
To make a short trade, the following conditions must be met:
Step 1 - The price touches the upper Bollinger band and closes inside the band.
Step 2 – Draw an uptrend line using at least two valleys.
Step 3 - We wait until the trend line drawn by a bearish candle is broken.
Step 4 – The Awesome Oscillator indicator should change color from green to red on the positive side.
By establishing all the steps, we open a short position.
●Exit Rules
Stop Loss: We consider the nearest resistance before breaking the trend line as the stop loss.
Target or take profit: The profit for this trade is determined by a risk-to-reward ratio of one to one or one to two in high-risk scenarios. Alternatively, hitting the upper band of the Bollinger Bands is considered the profit target for the trade.

Learn more:
1- Bollinger Band and KDJ trading strategy
2- Bollinger Bands trading strategy
Note: The recommended timeframe for this strategy is more than 3 minutes.
Conclusion
The trendline breakout strategy combined with Bollinger Bands and the Awesome Oscillator offers a structured and highly visual approach to identifying reversal-based trading opportunities. By waiting for the price to touch a Bollinger Band, drawing a valid trendline, and confirming the breakout with momentum signals from the AO, traders can reduce noise and avoid many false entries often seen in reversal trading. Clear stop-loss placement and flexible take-profit options also make this strategy suitable for traders who prefer systematic and rule-based setups.
With a recommended timeframe of three minutes or higher and using default indicator settings, this method provides a reliable framework for both beginner and intermediate traders to spot potential trend reversals more confidently.
Looking for more? Discover our other forex trading strategies and see how they can fit your trading style.
All-in-one trading resources.
From free custom indicators to ready-to-use Expert Advisors, we provide everything you need to trade smarter. Got your own idea? Let us build a tailored EA that follows the rules of your strategy.
Visit our Expert Advisor Shop
Check out our Free Indicators here
The EA for this strategy
The rules above, coded as a ready-made Expert Advisor. See its inputs and platforms, or ask for a modification.